
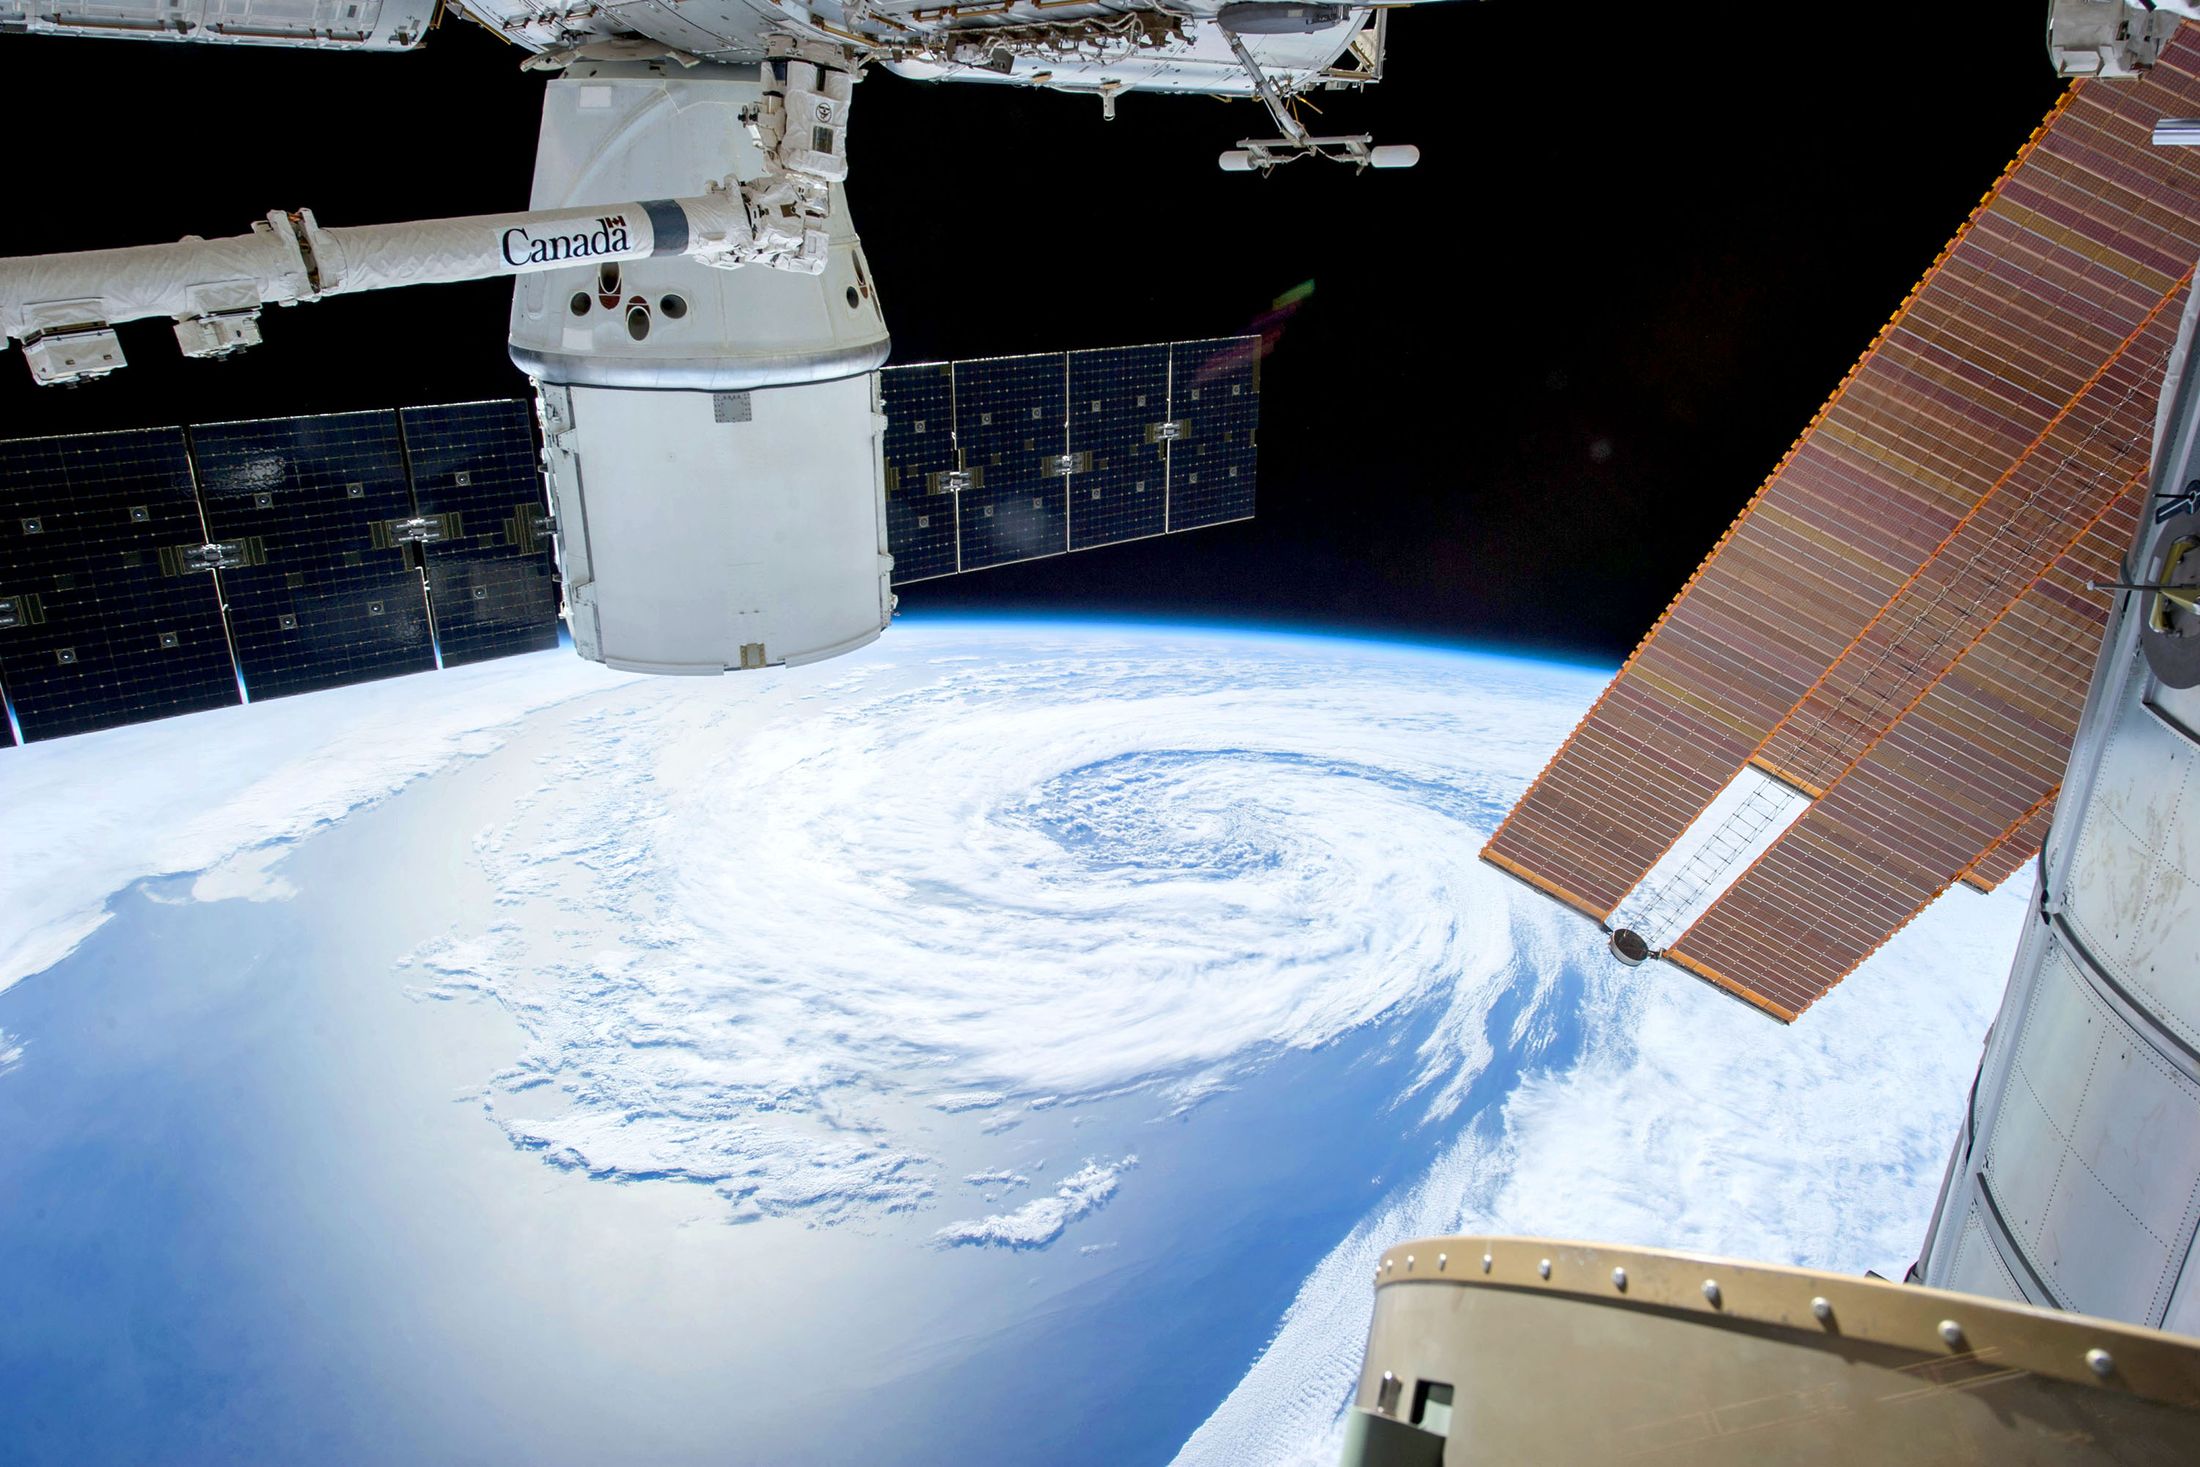
An atlas is valuable when it explains what each layer means. The interactive scene below is deliberately synthetic: it teaches how evidence types relate without implying that ViewPiece operates a live satellite map.
Three concepts, not live observations
Radar layer illustrates backscatter contrast: brightness can change with roughness, geometry, moisture, wavelength and polarisation. Change layer sketches a hypothetical spatial pattern; it is not a displacement product. Context layer represents environmental or geographic context that could help interpret a measurement. No sensor, place, date, spatial resolution or processing chain is represented in this demonstration.
A data-backed atlas would attach a record to every layer: instrument and product, acquisition date, processing baseline, coordinate system, spatial support, licence, transformations, quality flags and uncertainty. A derived layer would link to the source observations and make its assumptions visible.
How to read a real observation atlas
Start with the legend and product definition. Ask what physical quantity is encoded, whether values are calibrated, which date and geometry apply, and whether pixels show measurements, estimates or classification labels. Check how terrain and atmosphere affect the view. Compare against independent data where the decision requires it. A map is an interface to evidence, not a substitute for it.
Synthetic educational graphic only. No live satellite feed, geographic location, acquisition or analytical output is displayed.
Illustrative observation layers
Static synthetic illustration. Layer controls require JavaScript; no live data is displayed.